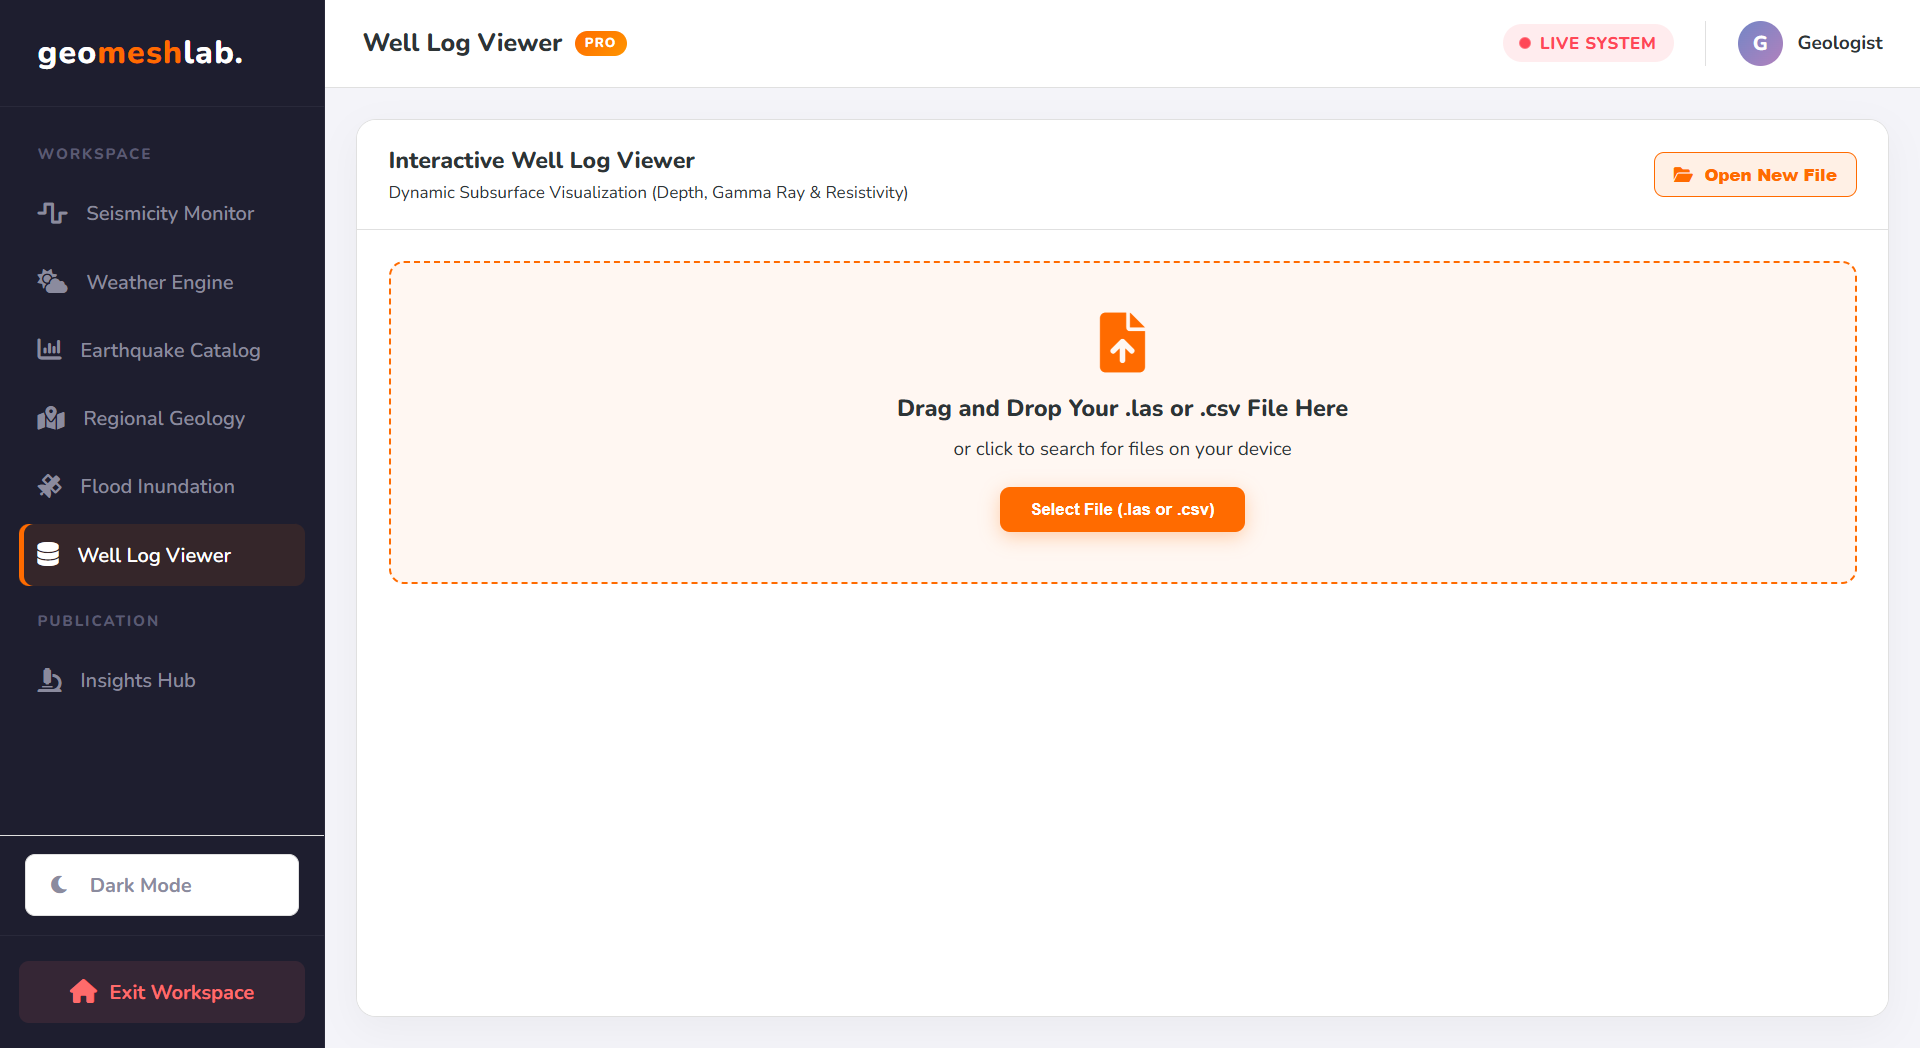
Seismicity Monitor & Temporal Time-Lapse Player
Real-Time Tectonic Intelligence and Spatial Simulation Engine
The Seismicity Monitor is a high-performance WebGIS dashboard engineered to visualize global tectonic activity with absolute precision. Connected directly to the USGS earthquake feed via asynchronous RESTful APIs, the system parses massive GeoJSON payloads and renders them onto a Leaflet canvas engine without compromising browser framerates.
Beyond simple dot-mapping, this dashboard introduces a proprietary Mercalli (MMI) Engine—a client-side algorithm that dynamically calculates surface impact intensity based on moment magnitude and hypocenter depth attenuation. The intelligence monitor automatically cross-references seismic events with a global volcanic registry, deploying a spatial buffer to detect early warning signs of volcanic swarms.
The crown jewel of this module is the Temporal Time-Lapse Player. Driven by a highly optimized JavaScript timeline interval, it sifts through chronological arrays, allowing geoscientists to simulate spatial earthquake sequences and visualize the rupture progression of active fault lines historically or in real-time.
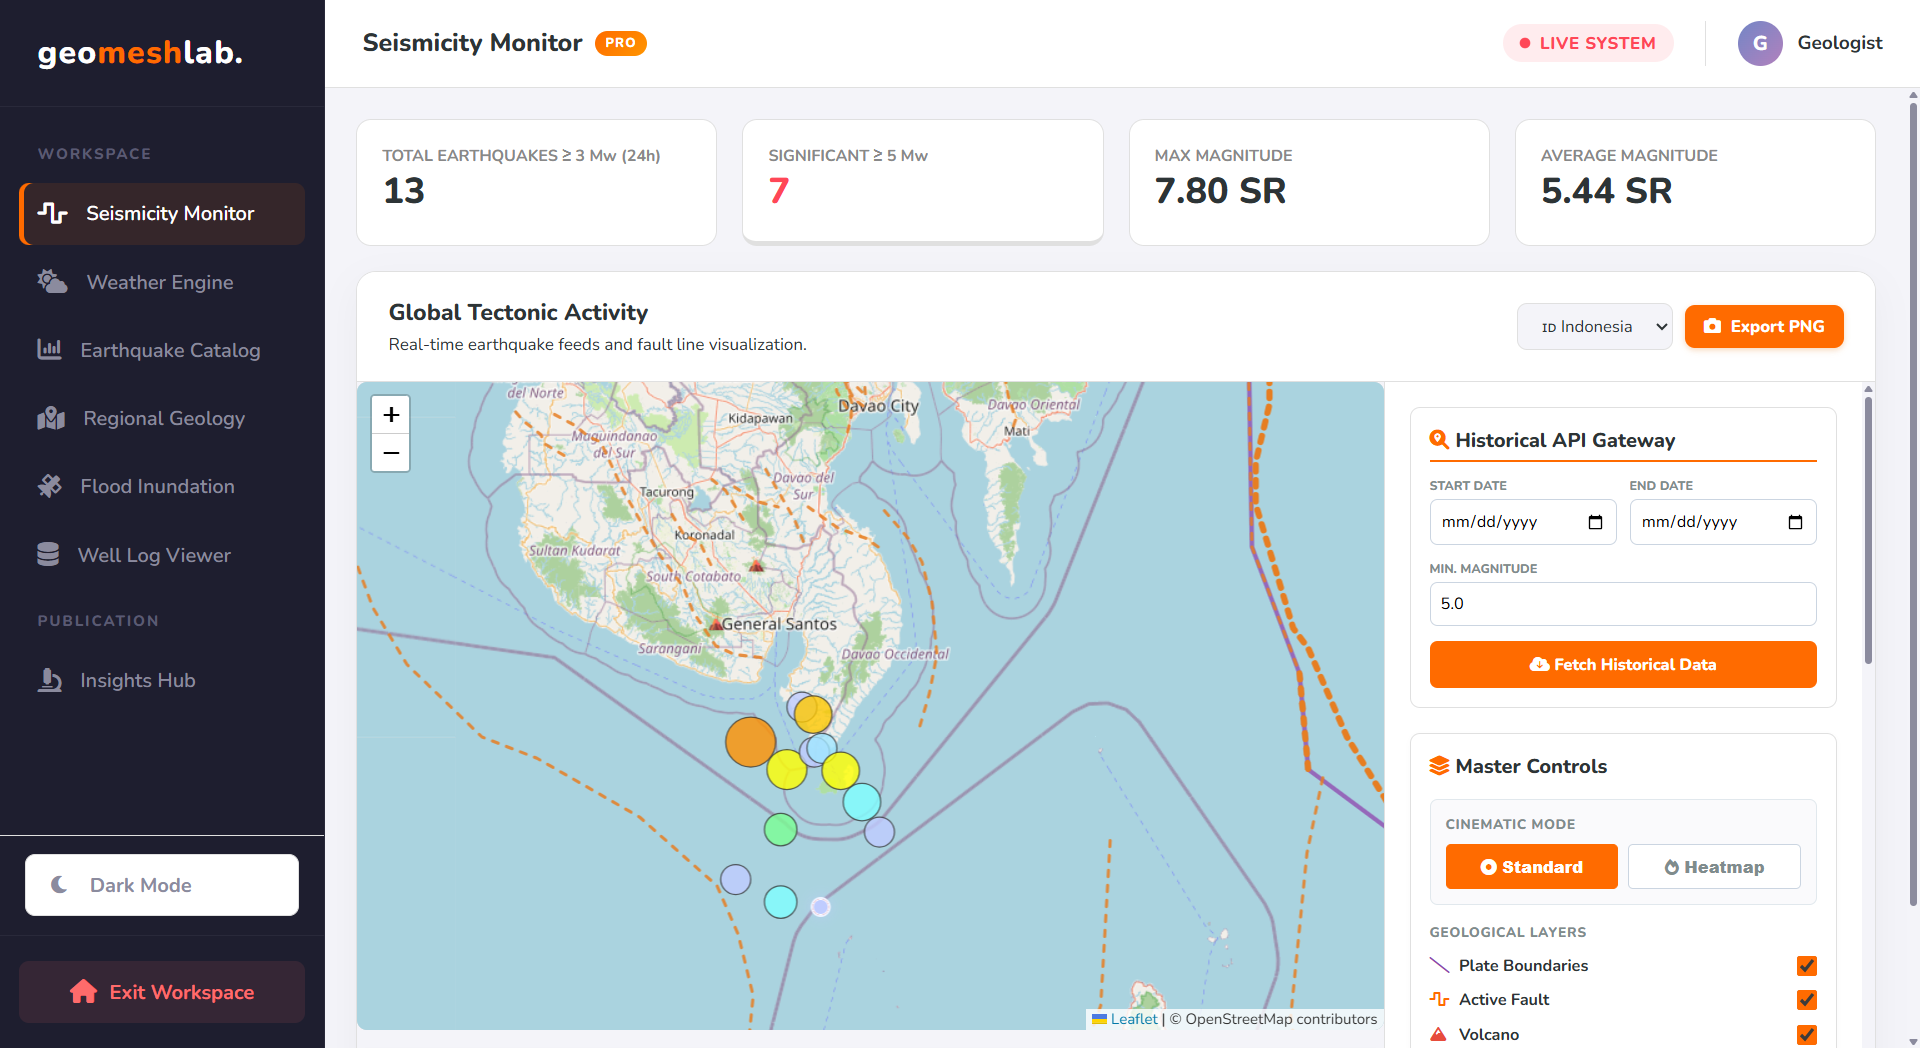
Weather Engine
Global Atmospheric Monitor & Climate Forecasting
The Weather Engine shifts the focus from the subsurface to the atmosphere, providing a sleek, highly responsive meteorological dashboard. Powered by the OpenWeatherMap API architecture, it delivers instantaneous localized weather parameters alongside a comprehensive 5-day climatic forecast.
From a development perspective, this dashboard demonstrates robust state management and graceful error handling. The JavaScript backbone utilizes dynamic DOM injection to construct forecast cards on the fly, ensuring a lightweight initial HTML load. To minimize redundant API calls and conserve bandwidth, the system incorporates a smart localStorage caching mechanism with automated timestamp validation.
Visually, the dashboard integrates smoothly with Leaflet to overlay live cloud cover and precipitation radar tiles. By utilizing customized FontAwesome iconography and an adaptive dark-mode color palette, the Weather Engine provides an intuitive, enterprise-grade user experience for environmental monitoring.
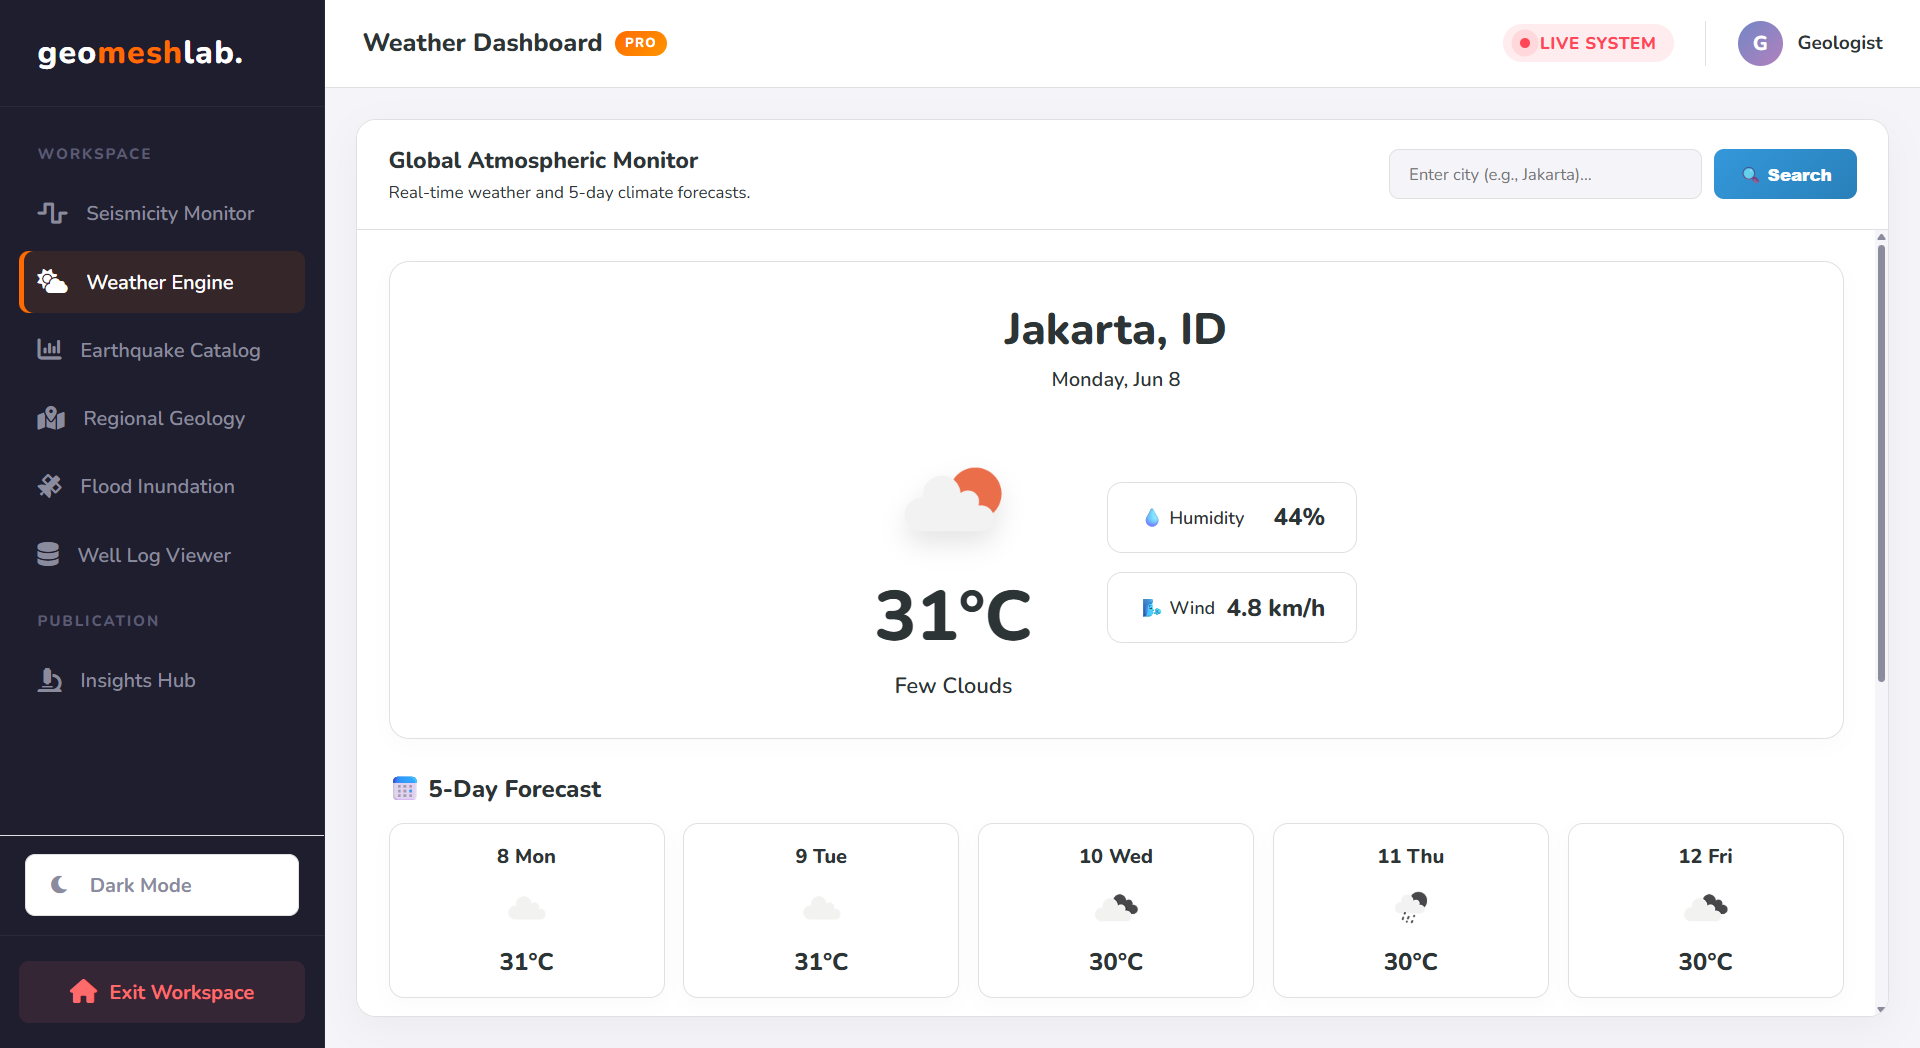
Earthquake Catalog Database
Historical FDSNWS API Gateway and Data Tabularization
The Earthquake Catalog acts as the primary data retrieval and archival hub for historical seismic research. Instead of relying on static daily feeds, this module features a custom-built URL query builder that communicates directly with the USGS FDSNWS event gateway. Researchers can filter decades of seismic history through precise parameters, including coordinate bounding boxes, specific depth ranges, and magnitude cut-offs.
Handling massive historical datasets in a browser environment poses a significant memory challenge. This dashboard solves that by employing an advanced, client-side pagination algorithm that slices large JSON arrays into manageable DOM tables, preventing memory leaks and UI freezing.
For offline geological analysis, the catalog is equipped with dual export engines. With a single click, the parsed API data is sanitized, formatted, and converted into downloadable CSV spreadsheets via Blob object generation, or beautifully structured PDF reports using the jsPDF library.
Regional Geology
Nationwide Lithology & Client-Side Spatial Geoprocessing
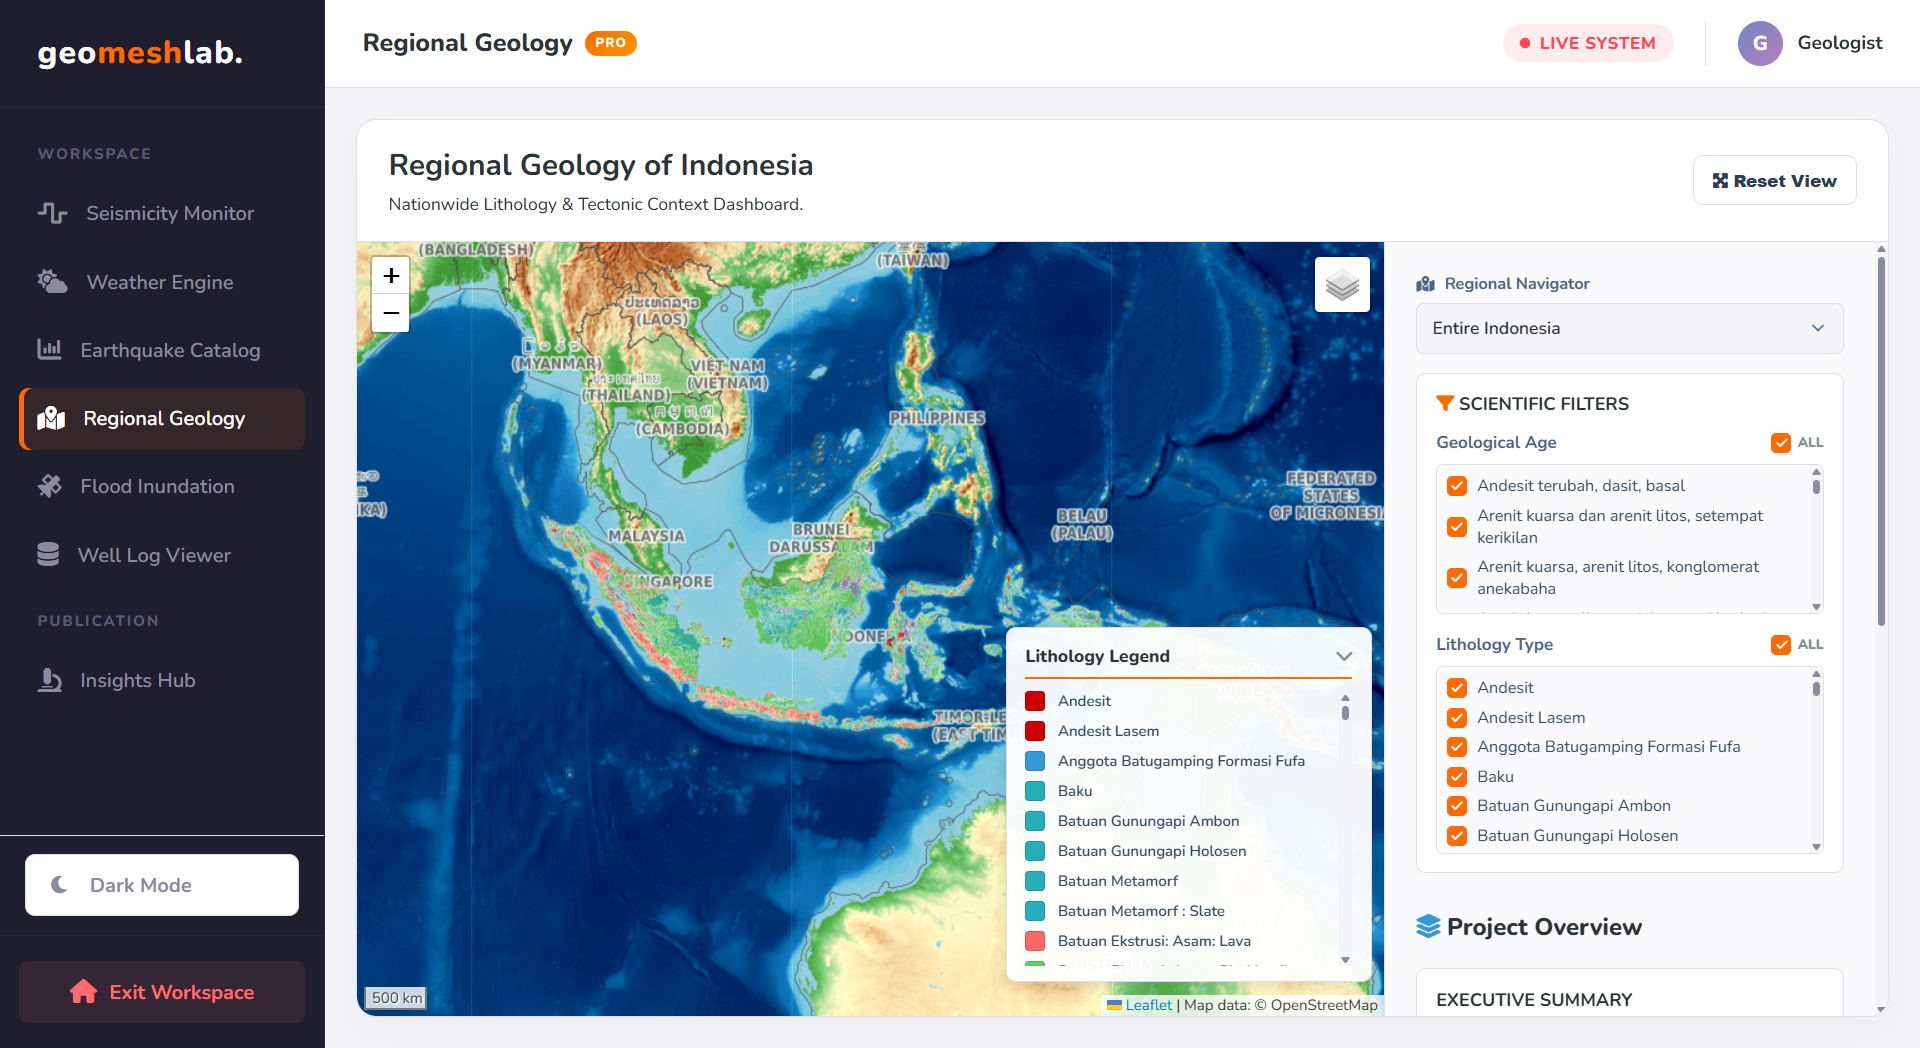
The Regional Geology dashboard is a heavy-duty WebGIS application designed to visualize complex, nationwide lithological and tectonic formations. Rendering hundreds of thousands of complex polygon vertices usually crashes standard web browsers. To overcome this, the dashboard utilizes GeoJSON-VT, a powerful rendering engine that slices massive geographic data into vector tiles on the fly, allowing for 60fps panning and zooming across the Indonesian archipelago.
This module pushes the boundaries of browser capabilities by integrating Turf.js for advanced spatial geoprocessing. Geologists can perform spatial intersections and administrative boundary clipping entirely on the client side—eliminating the need for expensive server-side GIS processing (like GeoServer).
Coupled with a dynamic tree-view regional navigator and an adaptive legend that updates based on the current canvas view, this tool empowers practitioners to extract and download isolated geological AOIs (Area of Interest) instantly.
Spectral Analytics
Multi-Index Satellite Raster Assessment Engine
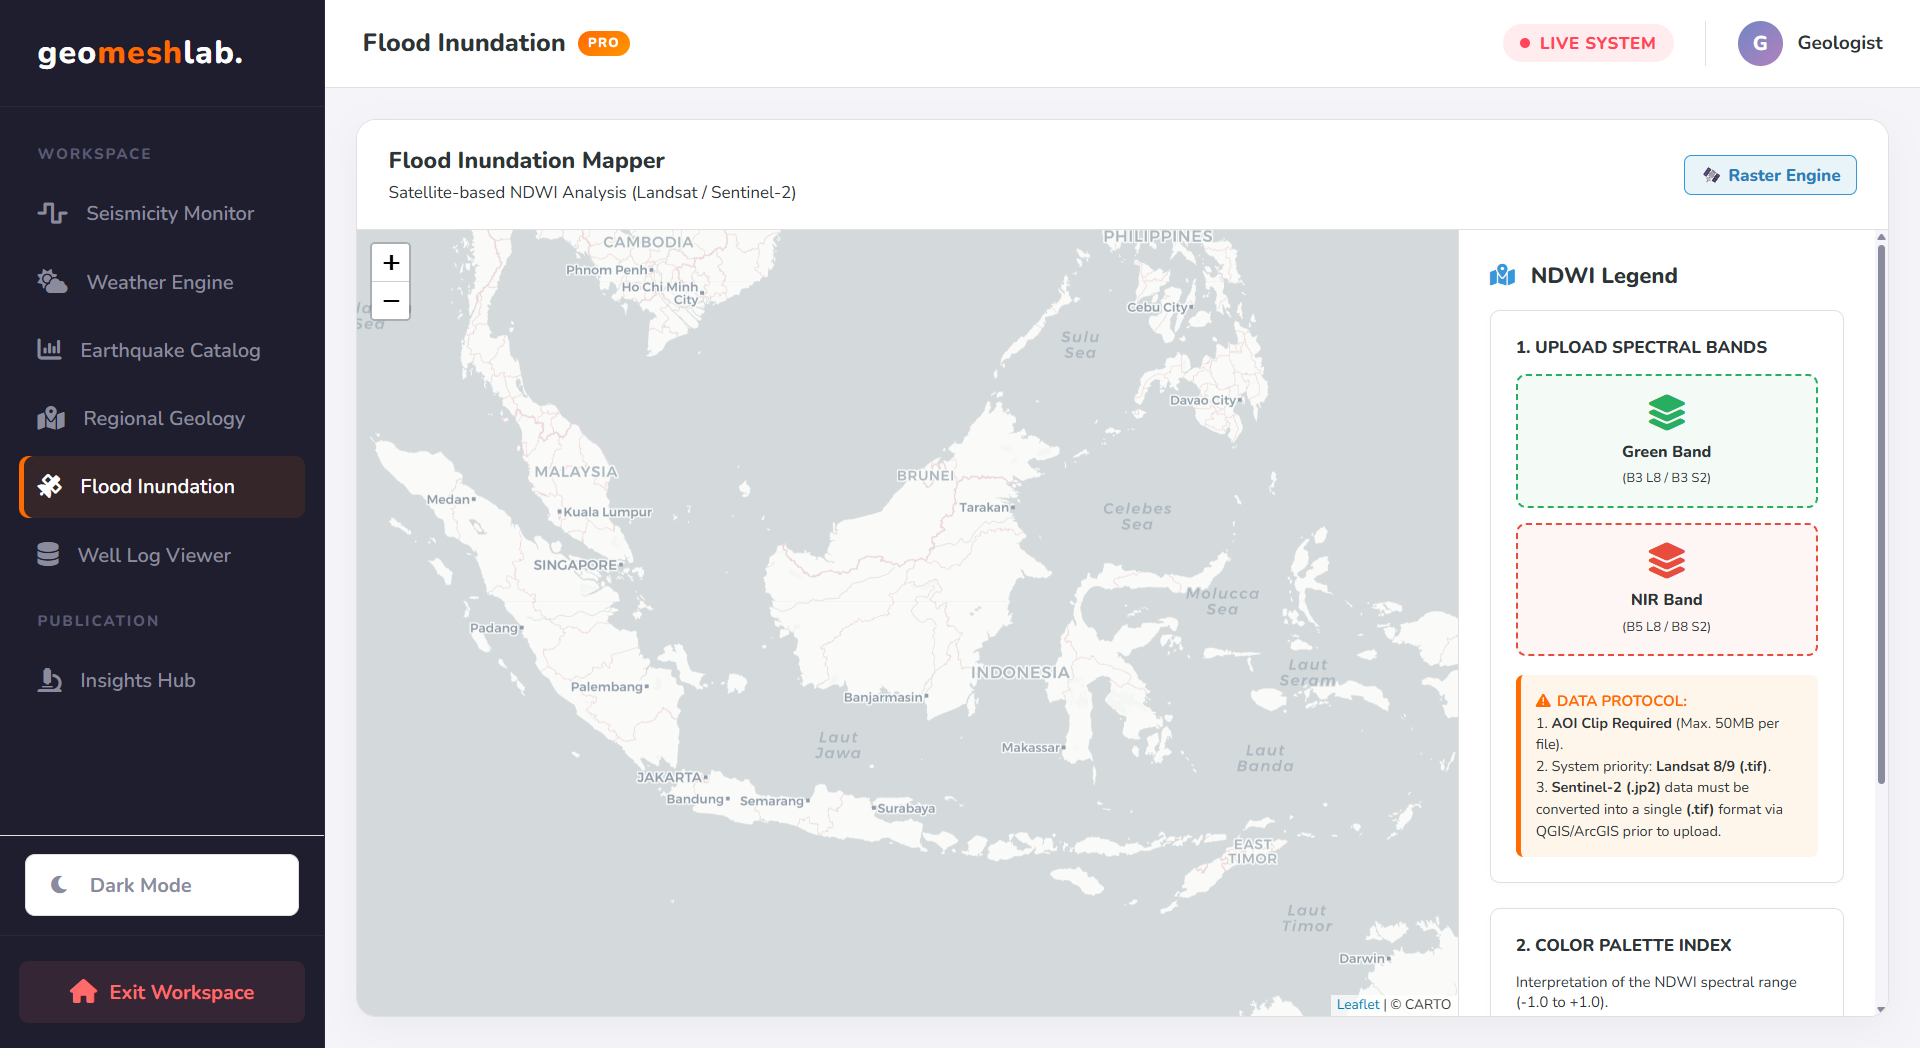
The Spectral Analytics dashboard brings remote sensing capabilities directly into the web browser, eliminating the immediate need for heavy desktop software like QGIS or ENVI for preliminary raster analysis. Designed to handle large .tif files, the engine utilizes georaster-layer-for-leaflet to parse and render raw satellite imagery matrices pixel-by-pixel on the canvas.
The core of this module is its dual-band processing architecture. Geoscientists can load specific multispectral bands (e.g., Green and NIR from Sentinel-2 or Landsat) into the dual dropzones. The JavaScript engine then performs on-the-fly pixel math to generate normalized indices like NDWI (Normalized Difference Water Index) for flood delineation or NDVI for vegetation health.
Featuring a temporal tab system, the dashboard allows users to load up to four different time periods of raster data. Combined with a custom opacity x-ray slider, researchers can seamlessly transition between timeframes to evaluate environmental changes, coastal erosion, or flood progression dynamically.
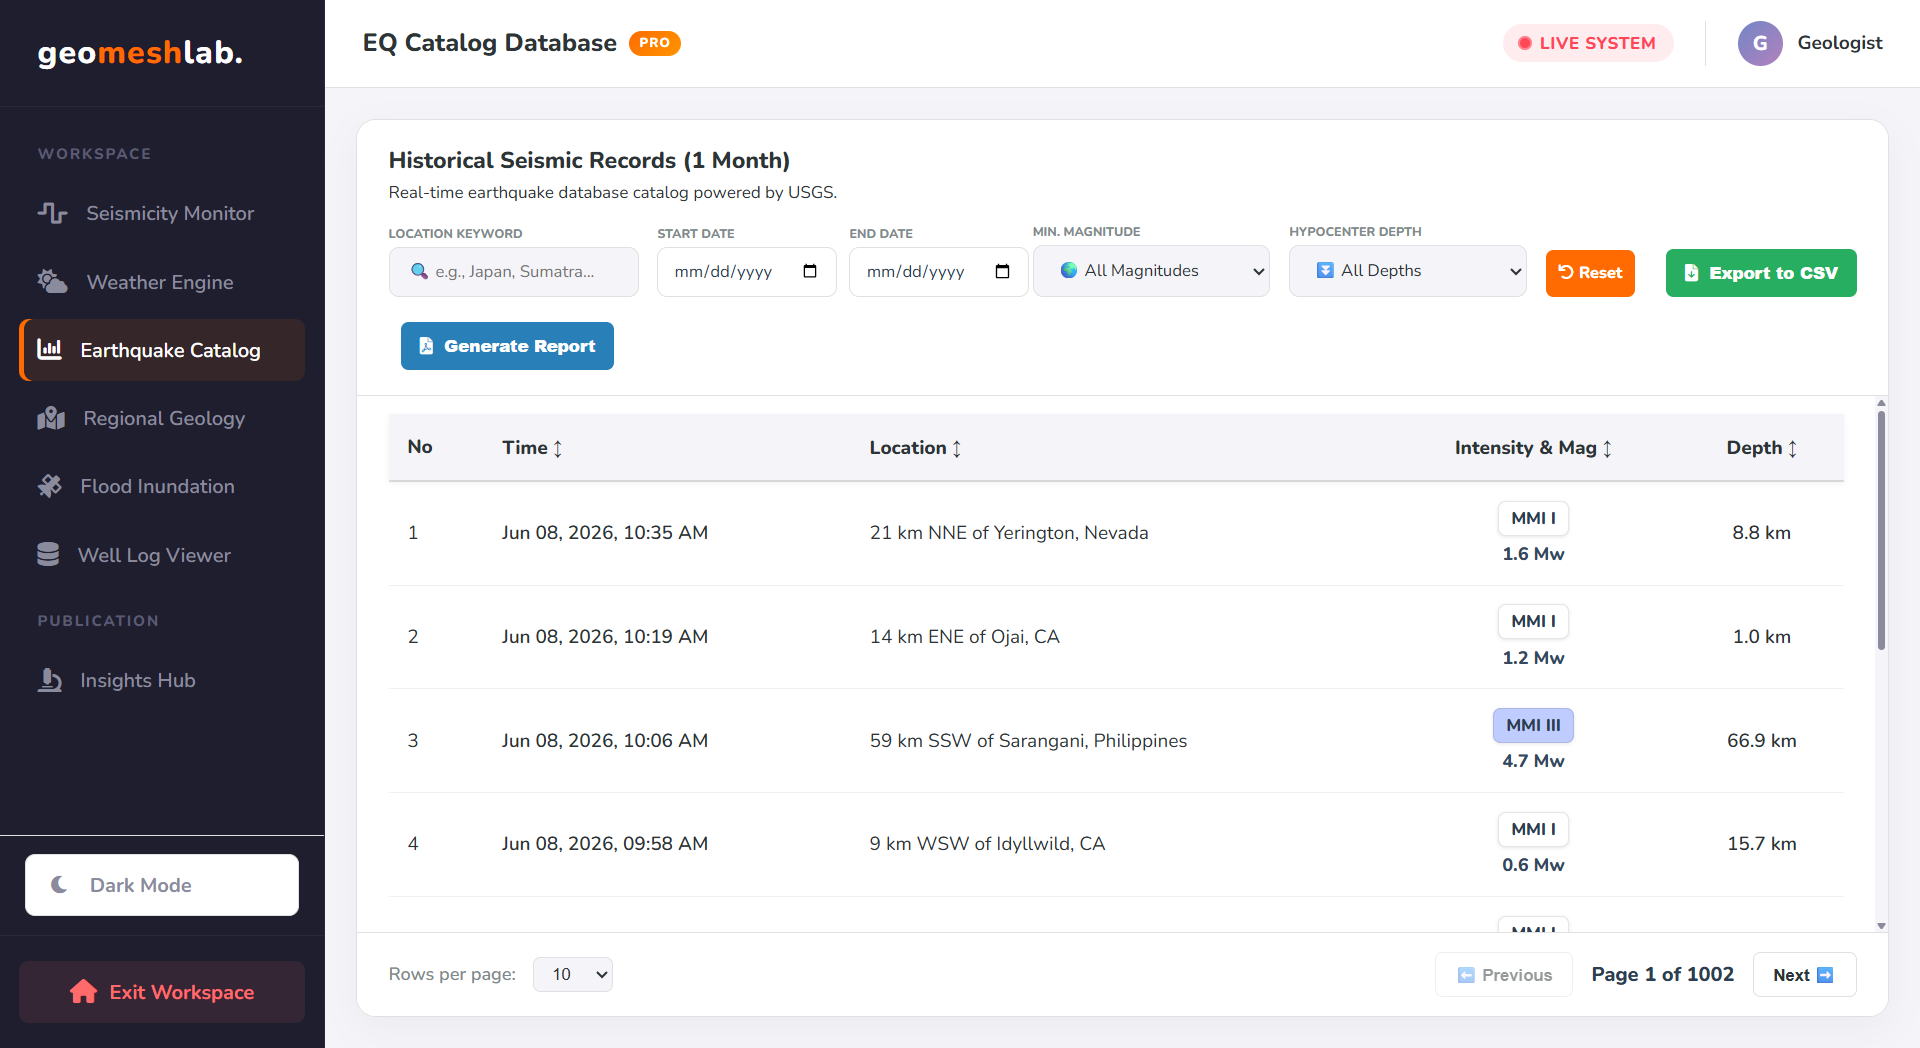
Well Log Viewer
Petrophysical Analysis & Stratigraphic Characterization Engine
The Well Log Viewer is a high-precision dashboard designed for petrophysical analysis and reservoir characterization. It serves as a vital instrument to penetrate the subsurface, converting raw physical signals into measurable stratigraphic models. By mapping Gamma Ray (GR) and Resistivity curves within a high-resolution interface, the system allows geoscientists to identify lithological boundaries and delineate net-pay zones with exceptional accuracy.
The dashboard utilizes a sophisticated client-side engine to render depth-indexed logging curves, facilitating an interactive interpretation workflow. It excels in decoding lithological signals: Gamma Ray logs identify shale baselines and potential reservoir sands, while resistivity anomalies provide absolute indicators of hydrocarbon accumulation.
Beyond simple visualization, this module is built to accelerate the calibration of well log data with regional petroleum system models, turning complex geophysical arrays into actionable geological insights.